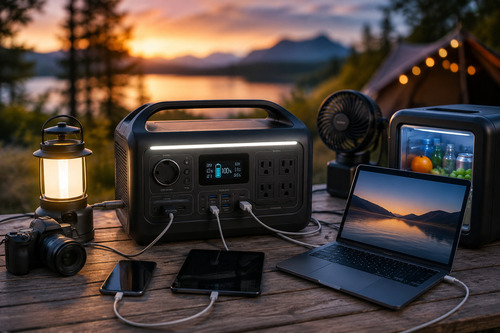
How long will a portable power station run? Divide modeled usable watt-hours by the total battery-side demand. For AC loads, include inverter loss and idle draw; for cycling appliances, use measured watt-hours over time. A 1,000Wh label is not a promise of ten hours at 100W.
Begin with the Energy Path, Not a Runtime Chart
Energy leaves the battery, passes through controls and possibly an inverter, then reaches the load. Each stage can change the result. The cleanest estimate keeps those assumptions visible instead of compressing them into one unexplained “real-world factor.”
runtime hours ≈ rated Wh × efficiency × (1 − reserve) ÷ (load W + idle W)
For measured battery-side watt-hours, do not subtract inverter loss a second time.
Use the Runtime Lab with Your Own Inputs
This calculator answers one transparent steady-load case. It cannot know the condition of the battery, changing appliance duty cycle, temperature, firmware behavior, or protective cutoff.
Portable Power Station Runtime Lab
Enter rated capacity and the average load for the selected time window.
Estimate only. A motor surge can fail even when the energy result looks long enough.
Three Loads That Break Simple Division in Different Ways
| Load profile | What simple division misses | Better input |
|---|---|---|
| Router | Station idle draw can be large beside a 10–20W load | Measure combined battery-side draw |
| Refrigerator | Compressor cycles and starts with a surge | Log Wh plus peak/start behavior |
| CPAP | Pressure, humidifier, and heated tube change demand | Use exact device guidance and settings |
| Power tool | Short high-current events | Peak capture and work-cycle energy |
| Heater | Steady high draw empties capacity quickly | Nameplate W × actual on-time |
A low average does not prove startup compatibility. A high continuous load may start easily but exhaust the battery much sooner than a buyer expects. Treat power feasibility and energy duration as separate results.
Build a One-Hour Load Diary for Cycling Equipment
For a cycling load, record when it is on and off. Suppose a compressor draws 120W for 18 minutes during one observed hour, while a 7W control load remains on.
- Compressor: 120W × 0.30 hour = 36Wh.
- Controls: 7W × 1 hour = 7Wh.
- Observed hour: 43Wh total, equivalent to a 43W hourly average.
- Modeled day: 43Wh × 24 = 1,032Wh only if conditions remain representative.
Repeat the diary under the conditions that matter. A refrigerator on a hot afternoon, a CPAP with heated humidification, and a cooler in a shaded vehicle can each produce a different load profile.
AC, DC, and Idle Demand Change Small-Load Results
An AC outlet requires the inverter to remain on. When the device draws only 12W, a few watts of inverter idle demand can materially shorten runtime. A manufacturer-approved DC adapter may bypass that stage, but voltage, polarity, connector, and device approval must all match.
| Path | What to enter | Do not do |
|---|---|---|
| AC plug meter only | Measured load W plus station idle W | Pretend the inverter is free |
| Battery-side monitor | Measured total W or Wh | Subtract conversion again |
| Approved DC adapter | Measured DC input at the battery side | Assume every cable is compatible |
| Multiple outputs | All simultaneous load energy | Count only the headline appliance |
| Charging while running | Separate source Wh and load Wh | Call net runtime “battery-only” runtime |
Temperature, Aging, and Cutoffs Move the Finish Line
Starting state of charge
A runtime model beginning at 100% cannot describe a station that was stored at 63%. Record the actual starting value and whether calibration is trustworthy.
Battery temperature
Published capacity and discharge limits apply under stated conditions. Cold or excessive heat can alter available energy and protective behavior.
Battery age and history
Capacity changes with cycles, calendar age, storage, and operating conditions. Replace the nameplate with a defensible measured value when the consequence matters.
Low-battery shutdown
The station or connected equipment may stop before arithmetic reaches zero. Preserve reserve and investigate which device caused the shutdown.
Use Ranges When the Input Is a Range
If a load varies from 60W to 100W, calculate both ends instead of publishing one false-precision answer. For a modeled 850Wh usable supply, that produces roughly 14.2 hours at 60W and 8.5 hours at 100W before adding any uncounted idle demand.
Replace the Estimate with a Commissioning Test
- ✅ Record starting charge, temperature, firmware, output mode, and every connected load.
- ✅ Log peak watts, total Wh, elapsed time, shutdown reason, and remaining reserve.
- ✅ Repeat the source transition if EPS/UPS behavior matters.
- ⚠️ Stop for heat, odor, damaged cables, moisture, unstable output, or repeated protection trips.
- ❌ Do not defeat protection or intentionally deep-discharge critical equipment.
Use the refrigerator outage workflow for food loads and the CPAP overnight plan for therapy equipment. Those decisions require more than generic runtime arithmetic.
Scenario Lab: Small AC Load with Large Idle Penalty
A 1,024Wh station begins full, preserves 10%, and the AC path is modeled at 85%. That leaves about 783Wh for the combined load. A 12W router plus an 8W inverter idle demand totals 20W, producing about 39 hours. Ignoring idle demand would predict roughly 65 hours—an error large enough to change an outage plan.
This is why a tiny load can be a poor use of a large always-on inverter. An approved DC path or a station with documented low-load behavior may materially improve the result, but measure rather than assuming a universal saving.
Scenario Lab: High Load Where Idle Barely Matters
Use the same modeled 783Wh for a 1,200W cooking appliance plus 8W idle demand. Runtime is about 0.65 hour, but that does not mean 39 minutes of useful cooking under every control cycle. The station must also support continuous power, and the appliance may switch elements or electronics in ways the average hides.
| Modeled load | With 8W idle | Without idle | What matters most |
|---|---|---|---|
| 12W router | About 39h | About 65h | Idle path |
| 60W laptop | About 11.5h | About 13.1h | Both |
| 150W refrigerator average | About 5.0h | About 5.2h | Cycling + startup |
| 600W tool | About 1.29h | About 1.31h | Duty cycle + surge |
| 1,200W heater | About 0.65h | About 0.65h | Steady energy demand |
Scenario Lab: Charging While the Load Runs
Suppose a station begins with 600Wh modeled usable energy, a load consumes 80W, and solar delivers a varying average of 45W to the battery across a four-hour window. Net depletion during that window is approximately 35W, or 140Wh, before any uncounted behavior. After solar ends, the full 80W load depletes the remaining energy.
That result answers a system-balance question, not battery-only runtime. Save source Wh and load Wh separately; otherwise a sunny test may create an unsafe promise for a cloudy outage.
Compare power rates over the same time, or convert each side to energy. An 80W load minus a 45W source is a 35W net rate only while both conditions continue.
Build an Error Budget Instead of One Mystery Discount
| Uncertainty | How to narrow it | Do not hide it as |
|---|---|---|
| Battery state of health | Capacity test per manufacturer procedure | Generic 20% loss |
| Conversion at this load | Battery-side and load-side measurement | Maximum-efficiency claim |
| Cycling duty | Representative Wh log | Nameplate W × 24h |
| Station idle demand | Measure outputs on with load off | Zero |
| Temperature effect | Test within intended environment | Universal cold factor |
As measurements improve, replace one uncertain input at a time. The model becomes more useful because its assumptions are visible, not because the final number gains more decimal places.
Measure a Cycling Appliance Without Guessing Its Duty Cycle
For a refrigerator, pump, fan, or compressor, a single instantaneous watt reading is incomplete. Measure energy over a representative window long enough to include several on/off cycles, defrost if relevant, and the expected room temperature. Divide measured watt-hours by elapsed hours to obtain an average power for that window, while keeping the separately observed startup peak for compatibility.
- Begin from a known station state and remove unrelated loads.
- Log the appliance Wh over a representative period rather than copying one display sample.
- Record peak W separately because average energy cannot prove startup compatibility.
- Repeat under a stress condition such as a warmer room or realistic door use.
- Use the higher justified energy case for the required runtime window.
Turn a Runtime Result into Operating Triggers
“About 14 hours” becomes useful only when it creates decisions. Define a reserve percentage at which discretionary loads stop, a point when food or medical equipment moves to the fallback plan, and the latest time recharge must begin. If the station reaches the trigger earlier than modeled, treat that as new evidence rather than spending the reserve.
| Observed result | Interpretation | Action |
|---|---|---|
| Runtime exceeds conservative case | Useful margin, not a new guarantee | Keep the lower planning case until repeated |
| Runtime matches model | Inputs are plausible for this condition | Retest after load or weather changes |
| Runtime is materially shorter | An assumption or condition is wrong | Audit load, loss, cycling, and battery state |
| Output trips before energy is low | Power/compatibility problem | Investigate surge, voltage, mode, or protection |
Preserve both the calculation and the test record. That lets another person distinguish a deliberate reserve from an unexpectedly empty battery during an outage.
Date the record and note firmware, battery age, ambient temperature, output mode, and attached expansion batteries. Those details explain why a later repeat may differ. Recalculate whenever the load group changes; adding one small always-on device can materially shorten a long low-power estimate.
Automatic-backup boundary: Runtime starts only after the load survives the transition. Use the UPS/EPS transfer-time and bypass compatibility check before treating an energy estimate as a backup plan.
Bottom Line: Runtime Is a Model You Can Audit
How long a portable power station will run depends on usable energy divided by total demand—not rated Wh divided by the appliance’s nicest-looking watt number. Make efficiency, reserve, idle demand, and duty cycle visible.
Calculate a range, then test the exact station and load while failure is inconvenient rather than dangerous. Save the measurements so the next estimate starts from evidence.